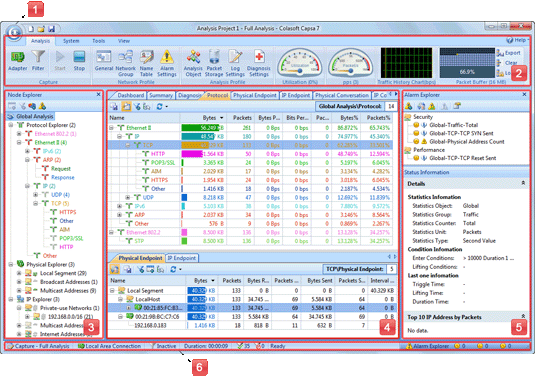
After a capture has been initiated, we come to the main Analysis Screen, which provides a wide range of statistics and analysis results for us to analyze and monitor our network. The main user interface is described below:

- Menu Button: click it to display the menu which contains all the infrequently used commands, i.e. Print, Engine Settings, Global Options, and so on.
- Ribbon: all frequently used commands of the older version are transplanted into big icons in the Ribbon, which enables us to find commands more conveniently and quickly.
- Node Explorer: organizes all the protocols, physical addresses and IP addresses appearing in our network in a hierarchical structure, which gives us a general understanding of the network communication. We can use it as a display filter to concentrate our analysis on a specific node as well.
- Main Views: the main part of the program, It provides all the statistics, diagnosis results, logs, reports, graphs, packets and matrix in 14 different tabs.
- Alarm Explorer: manages all the alarms and notifies us of all the activities violating our alarm rules with pop ups.
- Status Bar: displays general information with adapter name, filter settings, project duration, packet count and alarms statistics of the project.


Comments
Frank, the Diagnosis tab is only available for Capsa Enterprise. You can apply a Capsa Enterprise demo here to test it on your network: http://www.colasoft.com/download/products/download_capsa.php
RSS feed for comments to this post